STUDENTS: Mattia Sartori, Giacomo Mutti
SUPERVISORS: Prof. Mariolino De Cecco, Valentina Nardon, Luca Maule
Introduction
The purpose of the project is to automatically detect the different gait phases of a user which is walking with the help of an autonomous mobile walker. The walker is developed with the aim of supporting young girls affected by Rett syndrome throughout the path. This preliminary study shows how to analyse data acquired with a laser rangefinder positioned on the walker used by a healthy person to detect the phases of the gait cycle.
Gait phases
The gait cycle [1] refers to the repetitive motion of a leg during the walk. From a temporal perspective, it can be divided into two main phases (Figure 1):
- The stance phase of gait begins when the foot first touches the ground (heel strike) and ends when the same foot leaves the ground (toe off). The stance phase makes up approximately 60% of the gait cycle.
- The swing phase of gait begins when the foot first leaves the ground (toe-off) and ends when the same foot touches the ground again (heel strike). The swing phase makes up the other 40% of the gait cycle.
The cycle is intended for one leg, and it repeats symmetrically for the other.

The setup
The data were acquired by means of the laser rangefinder RPLidar A1 M8 [7] that creates a 2D point cloud of the surrounding space at 360°.
The sensor is placed on a plane horizontal support on the walker in front of the person at a heigh just under the knee (Figure 2). This position allows the LIDAR to monitor the region underneath the knee where the swing phase can be easily caught and, being in front of the user, both legs are always visible to the sensor.

Data acquisition and manipulation
Via the manipulation of the C++ code included in the sdk provided by the manufacturer [5], it was possible to record several subsequent acquisitions (turns) of the sensor and the output (angle and distance of each point in point of the cloud) was then handled with a MATLAB script (Figure 3).
The script filters out all the data outside the region of interest (defined by an angle between 160 and 200 degrees and a distance up to 900 mm) where the two legs reside. Indeed, in this region are visible the two arcs associated with the legs (Figure 4).
By identifying two moving search regions it was possible to segment the 2 legs. The search regions cover a constant interval and the points of a leg at each acquisition are the ones residing in the search regions (red boxes in Figure 5) centred in each leg’s centre of mass at previous acquisition (red dots in Figure 5). At the first iteration the legs are identified by choosing a threshold on the angle.
This approach ensures a correct tracking of the legs avoiding disturbances coming from the environment such as objects detected inside the first wider region of interest.

Since the sensor is very close to the legs, to obtain stable measurements, each leg is approximated with a circle of known radius (given by the circumference of the user’s leg). This results in a compact representation of the legs, which is reducing the influence of the shape deformations of the laser [3].
To locate the circumference, a specific algorithm was created. The concept is shown in Figure 6 and is as follows.
Focusing on a single leg, starting from the centre of mass, a grid of points P is created (green points in Figure 6). The best circumference is determined analysing the error committed by approximating the leg’s points Q with a circle of known radius centred in each grid point. The error is given by the sum of squared residuals between PijQk and the known radius r is calculated. The centre of the best fitting circumference is determined as the centre of mass of all the grid points where the mass is given by the inverse of the error.

The result is shown in Figure 7.

The circle fit is done at each revolution and its centre is used for the extraction of the following features that form a feature vector:
- Single leg coordinates (Figure 8)
- Single leg velocity along x (Figure 9)
- Legs relative distance
- Legs relative position
- Relative velocity along x
- Angle with respect of y axes

Gait phases individuation
Putting together all the feature vectors extracted, a global features table was created combining 4 different sets of measures taken in the laboratory, for a total of 582 Lidar revolutions.
At this point, a manual labelling of the whole dataset was done considering the following classes (phases):
1 – double support, left leg forward
2 – right leg swing
3 – double support, right leg forward
4 – left leg swing
5 – standing
The manual labelling was carried out by analysing the graphs of the single features and comparing them to a video recorded during the time of the data acquisition showing the feet of the user walking.
Gait phases automatic detection
Given the labelled dataset, 80% of it was used for training and the remaining 20% for testing.
Using MATLAB Classification Learner Toolbox it was possible to train several models in parallel and the best performing after training with K-fold cross validation was a Fine-KNN model. The confusion matrices obtained in the performance evaluation of the training and test phases are shown respectively in Figure 10 and Figure 11.
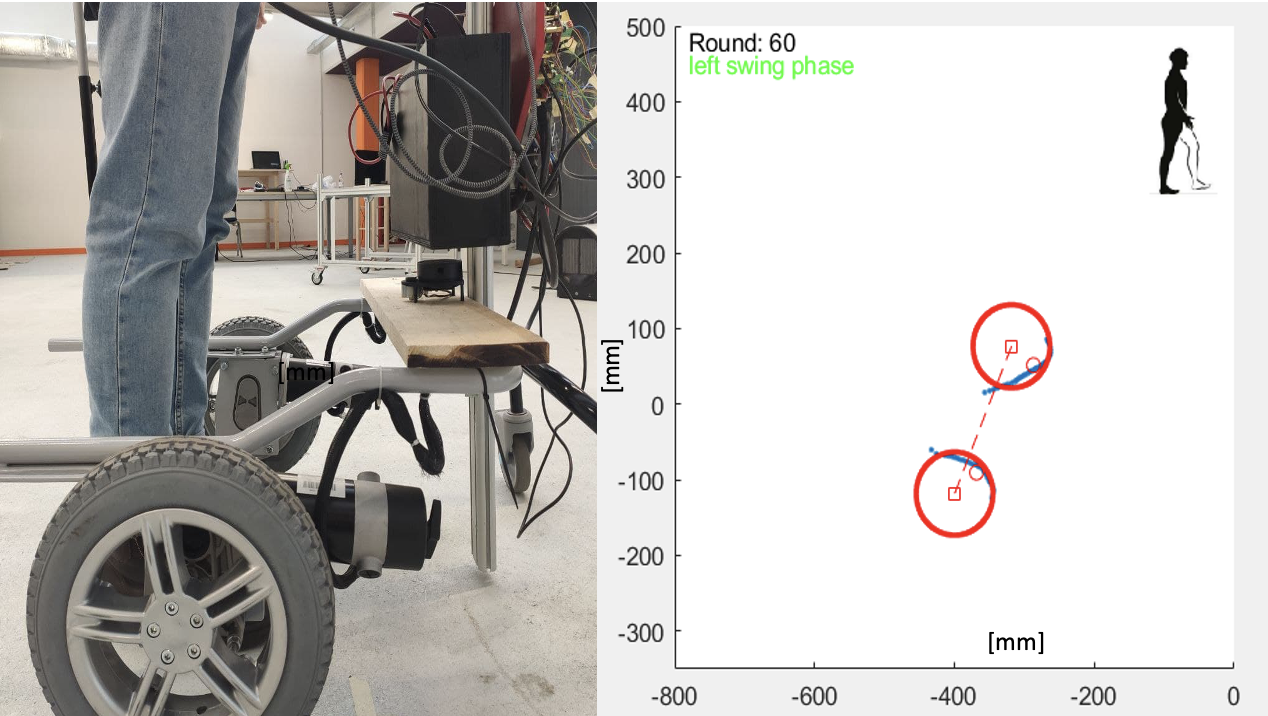
The trained model was applied in a demo simulation of the realtime gait phases detection showing the acquired legs’ points, the fitted circumferences, the detected phase both as a description and as an image (Figure 12).

Conclusions
After a couple of months of work it was possible to obtain a model that can detect the gait phases automatically from the measures acquired by a lidar placed on the autonmous walker.
It was not possible to test the realtime behavior, but the code [6] was developed in a way such that it can be easily transferred in a C/C++ application for realtime gait analysis and gait phases detection. Also some ML models trained with the Classification Learner can be exported in C/C++.
This project showed the feasibility and the accuracy of the analysis of gait parameters of a healthy user from lidar data. This is a basis for more advanced work in the analysis of the gait of young girls with Rett syndrome that will help in the development of an effective support in the walk of such users.
References
Books:
[1] Stergiou, N. (2020). Biomechanics and Gait Analysis (1st ed.). Academic Press.
[2] ScD, P. J. M., & PhD Pt, B. J. (2010). Gait Analysis: Normal and Pathological Function (Second ed.). Slack Incorporated.
Papers:
[3] H. T. Duong and Y. S. Suh, “Human Gait Estimation Using Multiple 2D LiDARs,” in IEEE Access, vol. 9, pp. 56881-56892, 2021, doi: 10.1109/ACCESS.2021.3071147.
[4] S. Sakdarakse and P. Somboon, “Development of LIDAR Based Gait Training System with Gait Assessment,” 2020 17th International Conference on Electrical Engineering/Electronics, Computer, Telecommunications and Information Technology (ECTI-CON), 2020, pp. 263-266, doi: 10.1109/ECTI-CON49241.2020.9158246.
Useful links:
[5] Slamtec A1M8 sdk: https://github.com/slamtec/rplidar_sdk
[6] Our GitHub repository: https://github.com/matsarto99/Gait_Analysis_RPA
[7] Slamtec RPLIDAR A1: https://www.slamtec.com/en/Lidar/A1